


We know keeping active is good for us and can help us feel good in many ways, but we wanted to know how exercise might be influencing different wellbeing measures such as anxiety and life satisfaction
The graph above shows that as the amount of moderate-intensity exercise performed per week increases, anxiety levels go down and life satisfaction goes up. Moderate-intensity activities include brisk walking, riding a bike on level ground, pushing a lawn mower or water aerobics, to name just a few. However, we also wanted to see whether combining different types of exercise together can benefit wellbeing, such as flexibility exercise (that’s stuff like Yoga, Pilates and Thai Chi).†
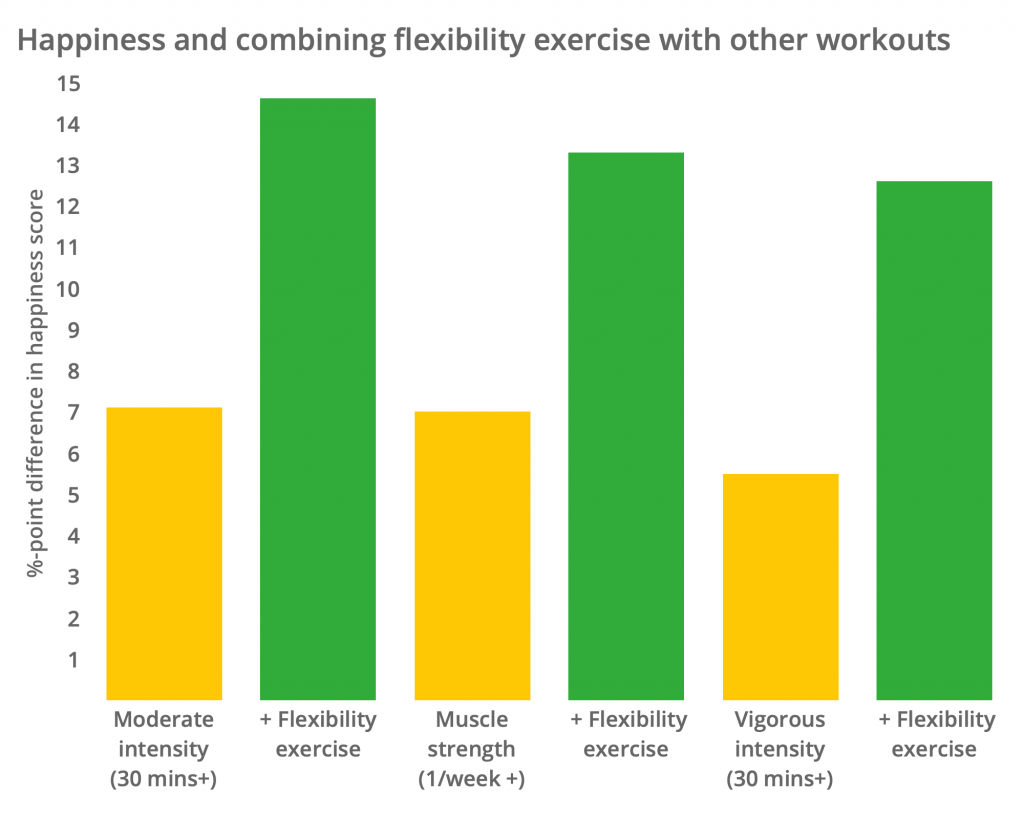
The graph above shows that when users in our community combine moderate/vigorous intensity exercise or muscle strength training with a flexibility exercise, they are more likely to report a higher happiness score. Therefore, combining flexibility exercise with other workouts is strongly associated with feeling happier. We cannot say that one causes the other.‡
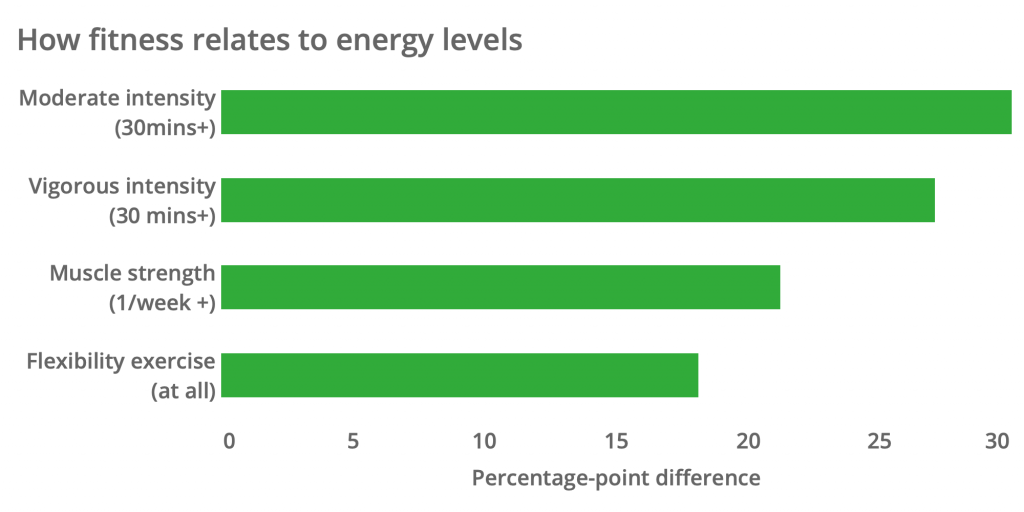
Now we’ve looked at how some exercises are associated with mental wellbeing, let’s explore how they relate to physical factors such as energy levels and BMI.§
It appears that if you want to boost your energy levels, the strongest link is with moderate-intensity exercise.
This chart shows that any form of exercise seems to have a similar, positive association with a healthy BMI.
To test your fitness levels and find more practical exercise tips, why not take a look at our Exercise to Energise article?
Statistical Disclaimers:
*Correlation ≠ Causality:
All statistical associations mentioned on this page represent statistically significant (95% level) correlations only. We do not make any claim of causality running in either direction between any two variables discussed, and have controlled for variation in age, sex and the Index of Multiple Deprivation (IMD) decile only.
†Moderate activity, life satisfaction and anxiety graph:
The displayed lines are for the predicted levels of life satisfaction and anxiety, from two ordinary least squares linear regression models. These are shown for sample average values of the covariates, switching values of moderate exercise for each data point. Both regressions also control for age, sex and IMD decile, along with a set of “moderately intense exercise” dummy variables (“Up to 30” being the omitted category). All of these dummy variables are statistically significant at the 95% confidence level.
‡Flexibility and happiness graph:
The displayed bars are for the coefficients from six ordinary least squares linear regression models. All models control for age, sex and IMD decile. The yellow bars display the coefficient for each exercise type, respectively. The green bars shows the sum of the coefficients for flexibility, each relevant exercise, and their interaction term. . All coefficients are statistically significant at the 95% confidence level.
§Correlates graph:
The displayed correlations are the coefficients from 8 linear probability models: 4 for energy levels; 4 for BMI. They all control for age, sex, and IMD decile, along with exercise type. The energy variable takes a value of 1 if a user has reported that they typically have enough energy, and zero otherwise; BMI take s value of one if BMI is between 18 and 25. All coefficients are statistically significant at the 95% confidence level.